
What’s in This Article:
Putting Efficiency Ratios to Work
Understanding How Efficiently Your Business Operates
Efficiency Ratios
Revenue growth is exciting, but it doesn’t always mean a business is operating efficiently. A company can bring in more revenue while still struggling to collect payments, manage expenses, or make the most of its resources.
That’s where efficiency ratios come in.
Efficiency ratios help business owners understand how effectively they’re using assets and managing financial obligations. They can highlight slow collections, changes in vendor payments, and opportunities to improve overall financial performance.
For service-based businesses and government contractors, these ratios can be especially helpful when evaluating cash flow, billing practices, and resource management.
Let’s look at six financial ratios and what they can tell you about your business.
Accounts Receivable Turnover
Accounts receivable (A/R) turnover measures how frequently a business collects its average outstanding receivables during a reporting period.
A higher turnover generally indicates that customers are paying more quickly. A lower turnover may suggest slower collections, extended payment terms, or billing issues.
Formula:
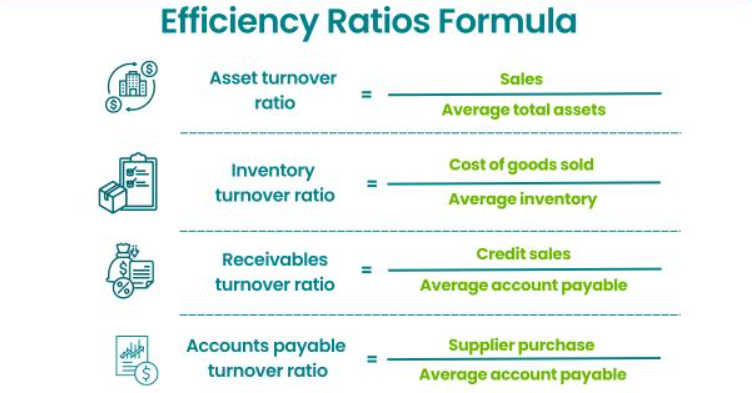
Accounts Receivable Turnover = Net Credit Sales ÷ Average Accounts Receivable
Net credit sales are sales made on credit, after applicable returns and allowances. Total revenue may be used as an approximation when credit sales cannot be separately identified and the difference is not significant.
Example:
$500,000 ÷ $20,000 = 25 times
This means the business collects an amount equivalent to its average accounts receivable balance approximately 25 times during the year.
For government contractors, monitoring this ratio can help identify delays in invoicing, payment processing, or collections.
Average Collection Period
The average collection period estimates how many days it takes a company to collect payment from customers.
It’s closely related to accounts receivable turnover and can help businesses determine whether customers are paying within their established terms.
Formula:
Average Collection Period = 365 Days ÷ Accounts Receivable Turnover
Example:
365 ÷ 25 = 14.6 days
In this example, the company takes approximately 15 days to collect its receivables.
A shorter collection period generally supports stronger cash flow. However, the results should be compared with customer payment terms and historical collection patterns.
For example, a 45-day collection period may be reasonable for customers with 45-day payment terms but could indicate a problem when invoices are due within 15 days.
Accounts Payable Turnover
Accounts payable (A/P) turnover measures how frequently a business pays its average outstanding supplier and vendor balances during a reporting period.
This ratio helps evaluate payment practices and how effectively the company manages its obligations.
Formula:
Accounts Payable Turnover = Credit Purchases ÷ Average Accounts Payable
When credit purchases are unavailable, the cost of goods or services sold may be used as an approximation, provided the business understands the limitations of that approach.
Example:
$350,000 ÷ $50,000 = 7 times
This means the company pays an amount equivalent to its average accounts payable balance approximately seven times during the year.
A higher turnover may indicate faster payments, while a lower turnover may reflect longer payment terms or delayed payments.
Neither result is automatically good or bad. Businesses should consider their cash flow, available discounts, and vendor agreements when evaluating this ratio.
Average Payment Period
The average payment period estimates how many days a company takes to pay its suppliers and vendors.
Understanding this timing can help businesses manage cash flow while maintaining good vendor relationships.
Formula:
Average Payment Period = 365 Days ÷ Accounts Payable Turnover
Example:
365 ÷ 7 = 52.1 days
In this example, the company takes approximately 52 days to pay its suppliers.
Longer payment periods may help preserve cash when they align with agreed-upon payment terms. However, consistently paying vendors late can damage relationships, result in penalties, or affect future credit arrangements.
The goal isn’t necessarily to pay as slowly as possible. It’s to manage payments strategically while meeting financial obligations.
Total Asset Turnover
Total asset turnover measures how efficiently a company uses its assets to generate revenue.
Assets may include cash, accounts receivable, equipment, and other resources used in daily operations.
Formula:
Total Asset Turnover = Net Revenue ÷ Average Total Assets
Example:
$500,000 ÷ $1,500,000 = 0.33 times
This means the business generates approximately $0.33 in revenue for every dollar of average assets.
A higher ratio generally indicates more revenue generated relative to the company’s asset base. However, asset requirements vary significantly by industry.
For example, professional service businesses often require fewer physical assets than construction or manufacturing companies.
Comparing asset turnover with similar businesses and reviewing changes over time provides more meaningful insight than looking at the ratio alone.
Return on Investment
Return on investment (ROI) measures the return generated relative to the amount invested.
Although ROI is primarily a profitability or investment-performance measure rather than a traditional efficiency ratio, it can complement efficiency analysis when evaluating how effectively resources are being used.
Formula:
ROI (%) = Defined Investment Return ÷ Investment Cost × 100
For this example, we’ll use income before taxes as the return measure.
Example:
$200,000 ÷ $1,000,000 × 100 = 20%
This means the company generated $0.20 in pretax income for every dollar invested.
ROI can help business owners evaluate major purchases, technology investments, or business expansion opportunities.
However, ROI calculations can vary depending on what is included in the return and investment amounts. Businesses should use a consistent methodology when comparing investment alternatives.
Fixed Asset Turnover
Fixed asset turnover measures how efficiently a company uses its property, plant, and equipment (PP&E) to generate revenue.
Fixed assets may include machinery, vehicles, equipment, buildings, and other long-term tangible assets.
Formula:
Fixed Asset Turnover = Net Revenue ÷ Average Net Fixed Assets
Net fixed assets generally represent the carrying value of property, plant, and equipment after accumulated depreciation and applicable impairment losses.
Example:
$500,000 ÷ $1,000,000 = 0.50 times
This means the company generates $0.50 in revenue for every dollar invested in average net fixed assets.
A higher fixed asset turnover ratio generally indicates that a company generates more revenue relative to its fixed asset base.
However, the appropriate ratio depends heavily on the industry.
Professional service businesses often require fewer fixed assets, while construction and manufacturing companies may depend on substantial equipment and facilities.
A lower ratio may reflect recent equipment purchases, underutilized assets, or the nature of the company’s operations.
Businesses should also consider depreciation and asset age, which can significantly influence the calculation.
Putting Efficiency Ratios to Work
Efficiency ratios are most valuable when used together and reviewed consistently.
For example, a company might report strong revenue growth but experience slower customer collections. While sales are increasing, the business may still face cash flow challenges because more money is tied up in accounts receivable.
Similarly, a business may improve cash flow by extending vendor payments, but consistently paying beyond agreed terms could create other problems.
Regularly reviewing efficiency ratios can help business owners:
- Identify billing and collection delays.
- Evaluate vendor payment practices.
- Monitor how effectively assets generate revenue.
- Recognize changes in operating performance.
- Make more informed financial decisions.
The important thing is to understand what the numbers are telling you rather than focusing on achieving a particular ratio.
For government contractors, efficiency analysis can also complement project-level financial reporting, indirect cost monitoring, and cash flow forecasting.
Understanding How Efficiently Your Business Operates
Strong financial performance isn’t just about bringing in more revenue. It’s also about collecting payments, managing obligations, and using resources effectively.
Efficiency ratios provide another way to evaluate how well your business is operating and where improvements may be needed.
At Cheryl Jefferson & Associates, we help growing businesses and government contractors understand their financial performance through accounting, financial analysis, and virtual CFO services.
Want a clearer picture of your company’s financial performance? Contact CJA to learn how we can help you turn financial information into better business decisions.
Frequently Asked Questions
What are efficiency ratios?
Efficiency ratios measure how effectively a business uses its assets and manages financial obligations to support operations and generate revenue.
What is a good accounts receivable turnover ratio?
There is no universal benchmark. A good ratio depends on the industry, customer payment terms, and the company’s collection practices.
How often should businesses review efficiency ratios?
Monthly or quarterly reviews can help businesses identify changes in collections, vendor payments, and asset utilization before they become larger issues.