What’s in This Article
Gross Profit Margin
Operating Profit Margin
Net Profit Margin
Return on Assets
Return on Equity
Return on Capital Employed
Putting Profitability Ratios to Work
Frequently Asked Questions
Understanding Your Business’s Profitability
Financial data alone doesn’t always tell the whole story about a company’s performance. Looking at revenue or net income is a good starting point, but how do you know whether your business is actually performing well?
That’s where financial ratios come in.
Financial ratios help business owners evaluate performance, identify trends, and compare results with relevant industry benchmarks. They can reveal whether a company is controlling costs, using its resources efficiently, and generating enough profit to support future growth.
Financial ratios generally fall into several categories, including profitability, efficiency, liquidity, and leverage. In this article, we’ll focus on six profitability ratios and what they can tell you about your business.
Gross Profit Margin
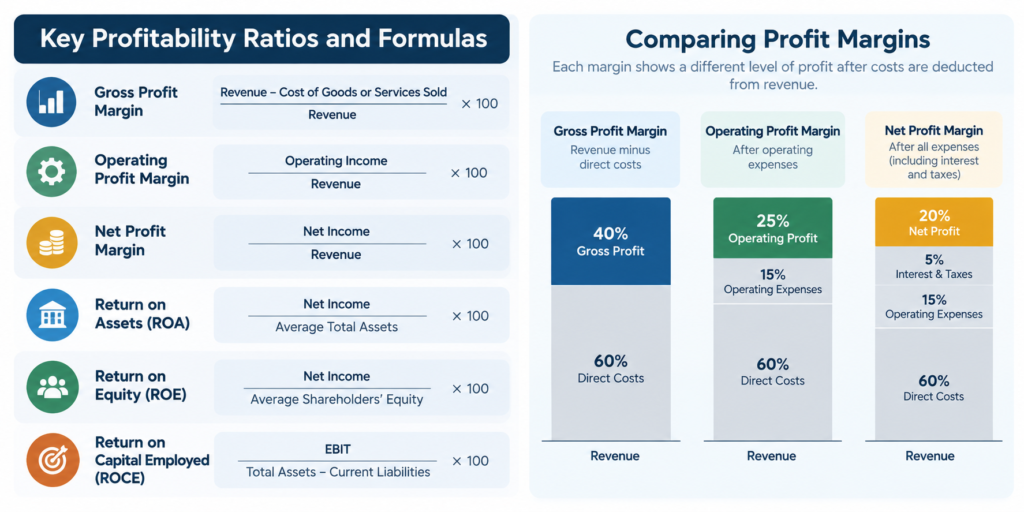
Gross profit margin measures the percentage of revenue remaining after deducting the direct costs of providing goods or services.
For service-based businesses, these direct costs may include project labor, subcontractors, and other expenses directly associated with delivering services, depending on how the company classifies its costs.
Formula:
Gross Profit Margin = (Revenue − Cost of Goods or Services Sold) ÷ Revenue × 100
Example:
($2,000 − $1,200) ÷ $2,000 × 100 = 40%
This means the company retains $0.40 of gross profit for every dollar of revenue before accounting for other operating expenses.
Monitoring gross profit margin can help identify changes in pricing, labor costs, and project profitability.
Operating Profit Margin
Operating profit margin measures how much profit a business generates from its core operations after accounting for direct costs and operating expenses.
These expenses often include overhead and general and administrative (G&A) costs.
Formula:
Operating Profit Margin = Operating Income ÷ Revenue × 100
Example:
$500 ÷ $2,000 × 100 = 25%
An operating profit margin of 25% means the company generates $0.25 in operating profit for every dollar of revenue.
A declining margin may indicate rising overhead, increasing labor costs, pricing issues, or changes in the mix of services provided.
For government contractors, monitoring operating margins alongside indirect cost rates can provide additional insight into how costs affect overall profitability.
Net Profit Margin
Net profit margin measures the percentage of revenue remaining after accounting for all expenses, including operating costs, interest, and applicable income taxes.
Unlike gross and operating profit margins, net profit margin reflects the company’s overall profitability.
Formula:
Net Profit Margin = Net Income ÷ Revenue × 100
Example:
$400 ÷ $2,000 × 100 = 20%
This means the business earns $0.20 in net income for every dollar of revenue.
A strong net profit margin may indicate effective cost management and pricing. However, what qualifies as a healthy margin varies by industry, business model, and company size.
Return on Assets
Return on assets (ROA) measures how effectively a business uses its assets to generate net income.
Assets may include cash, accounts receivable, equipment, and other resources used in business operations.
Formula:
Return on Assets = Net Income ÷ Average Total Assets × 100
Example:
Beginning Total Assets = $2,132,000
Ending Total Assets = $2,434,000
Net Income = $213,000
Average Total Assets = ($2,132,000 + $2,434,000) ÷ 2 = $2,283,000
Return on Assets = $213,000 ÷ $2,283,000 × 100 = 9.33%
This means the company generated approximately $0.093 in net income for every dollar of average assets.
ROA is particularly useful when comparing companies within the same industry. Businesses requiring substantial investments in equipment or facilities may naturally have lower returns than service-based businesses with fewer physical assets.
Return on Equity
Return on equity (ROE), sometimes called return on net worth, measures how effectively a company generates profit from its shareholders’ equity.
Shareholders’ equity generally includes invested capital and retained earnings, adjusted for other equity transactions and balances.
Formula:
Return on Equity = Net Income ÷ Average Shareholders’ Equity × 100
Example:
Net Income = $500,000
Average Shareholders’ Equity = $900,000
Return on Equity = $500,000 ÷ $900,000 × 100 = 55.56%
This means the company generated approximately $0.56 in net income for every dollar of average shareholders’ equity.
While a higher ROE can indicate strong profitability, it should be evaluated carefully. High debt levels or unusually low equity balances can increase ROE without necessarily indicating stronger business performance.
Return on Capital Employed
Return on capital employed (ROCE) measures how efficiently a company generates operating profit from the capital used in its business.
It is particularly useful when evaluating businesses that rely on a combination of debt and equity financing.
Formula:
Return on Capital Employed = EBIT ÷ Capital Employed × 100
Where:
-
EBIT = Earnings Before Interest and Taxes
-
Capital Employed = Total Assets − Current Liabilities
Example:
EBIT = $100,000
Total Assets = $100,000
Current Liabilities = $25,000
Capital Employed = $100,000 − $25,000 = $75,000
Return on Capital Employed = $100,000 ÷ $75,000 × 100 = 133.33%
This means the company generated approximately $1.33 in operating profit for every dollar of capital employed during the period.
Although this is mathematically correct, a return this high is unusual and should be examined in context. ROCE is most useful when compared consistently across reporting periods and against similar businesses.
Putting Profitability Ratios to Work
Profitability ratios do more than measure financial performance. They help business owners understand what’s driving their results.
For example, a company may experience increasing revenue while its operating profit margin declines. That could be a sign that labor costs, overhead, or other expenses are growing faster than revenue.
Reviewing these ratios regularly can help businesses:
-
Identify changes in profitability before they become larger problems.
-
Evaluate pricing and cost management.
-
Compare performance against historical results and relevant industry benchmarks.
-
Make more informed decisions about hiring, investments, and growth.
The key is to look at financial ratios together rather than relying on a single calculation. Ratios also need to be interpreted alongside cash flow, financial forecasts, and the company’s operating circumstances.
Understanding the Numbers Behind Your Business
Knowing your revenue is important. Understanding how much of that revenue turns into profit, and why, is even more valuable.
At Cheryl Jefferson & Associates, we help growing businesses and government contractors understand their financial performance through accounting, financial analysis, and virtual CFO services.
Ready to put your financial data to better use? Contact CJA to discuss how we can help you make more informed business decisions.
Frequently Asked Questions
What are profitability ratios?
Profitability ratios measure how effectively a business generates earnings relative to its revenue, assets, equity, or capital employed. See different types of Ratios below.
How often should businesses review financial ratios?
Many businesses benefit from reviewing key profitability ratios monthly or quarterly. The appropriate frequency depends on reporting needs and business activity.
What is a good profitability ratio?
There is no universal benchmark. A healthy ratio depends on the industry, company size, business model, and historical performance.